


Channelholic regulars may recall a July article here based on a June interview with Peter Kujawa, the EVP in charge of ConnectWise’s Service Leadership unit and IT Nation community, about a mysterious service multiple of wages trend in Service Leadership’s recent MSP market data.
In extremely crude terms, service multiple of wages divides the fully burdened cost of delivering services into the revenue those services generate. Kujawa (pictured) considers it one of the most critical metrics an MSP can track.

“When I’m asked to look at somebody’s results when they start benchmarking with us, my eye first goes to their profitability. The second place my eye goes is service multiple of wages, because it really tells you how well run the service factory is and it ultimately is going to lead to greater profitability,” he says on an upcoming episode of MSP Chat, the podcast I co-host.
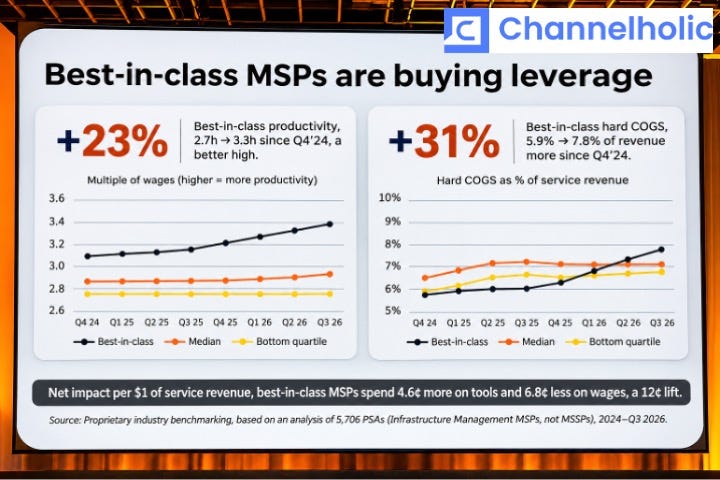
Service Leadership has long advised MSPs to shoot for a 2.5 SMW and long watched best-in-class MSPs in the industry’s top quartile average 2.7. Until suddenly, in the middle of 2025, top-quartile SMWs began rising quarter over quarter from 2.7 to 2.8 to 2.9 to an all-time high of 3.01 in Q1 of this year, even as the middle 50% of MSPs saw minimal improvement and bottom-quartile MSPs saw none.
The mystery was why, and Kujawa’s theory was that AI was the answer. Best-in-class MSPs appreciate the value of advanced tooling and spend more on it, he reasoned, so they were probably earlier, heavier adopters of service desk automation software than their less profitable peers and getting outsized returns from it.
Real-world example: WheelHouse IT eliminated over 90% of the Microsoft 365 work its human technicians had been responsible for after deploying Thread’s automation software, according to Matt Linn, Thread’s co-founder an COO. “That ended up being about 19% of their overall service request volume. Zero touch.”
Stories like that had Kujawa predicting, during our conversation this June, that average SMWs for top-quartile MSPs could reach a new all-time high of 3.4 by next June. It sounded a little crazy five months ago, but not so much now. Because it turns out that SMWs for top-quartile MSPs hit 3.32 in Q3, a full nine months ahead of schedule, per data Kujawa presented at IT Nation Connect in the left-hand graph above.
“What we’re seeing is the best in class hitting numbers we’ve never seen in 21 years,” Kujawa says.
Accompanying data in the right-hand graph above hints heavily at what’s responsible. The same top-quartile MSPs outgrowing everyone else on SMW are also outgrowing everyone else on tool spending, as measured by cost of goods sold. And per additional data not depicted on either graph, they’re hiring new FTEs at a significantly slower pace than the rest of the pack too.
Which means the most profitable MSPs in the industry spend 4.6% more than others on a modest expense, tools, and 6.8% less than others on their biggest expense, labor. And since service desk automation software is still getting better and early adopters are getting better at using it, there’s every reason to expect further SMW gains ahead.
“At the pace of improvement we’re running, it’s plausible that by the end of next year we could see a 4.0,” Kujawa says.
I’m not prepared to call that crazy at this point, either. How about you?
Get the whole story straight from Kujawa
That MSP Chat interview with Kujawa may well be live by the time you read this, and if so you really shouldn’t miss it because it gets into other interesting trends concerning matters like rising revenue per employee. That episode and all our others with industry thought leaders are eagerly awaiting your attention here.
